Burnaby vs Coquitlam: Population & Income Compared
Side-by-side 2021 figures for Burnaby and Coquitlam: population, growth, median household income, and average age — with links to full profiles and the comparison tool.
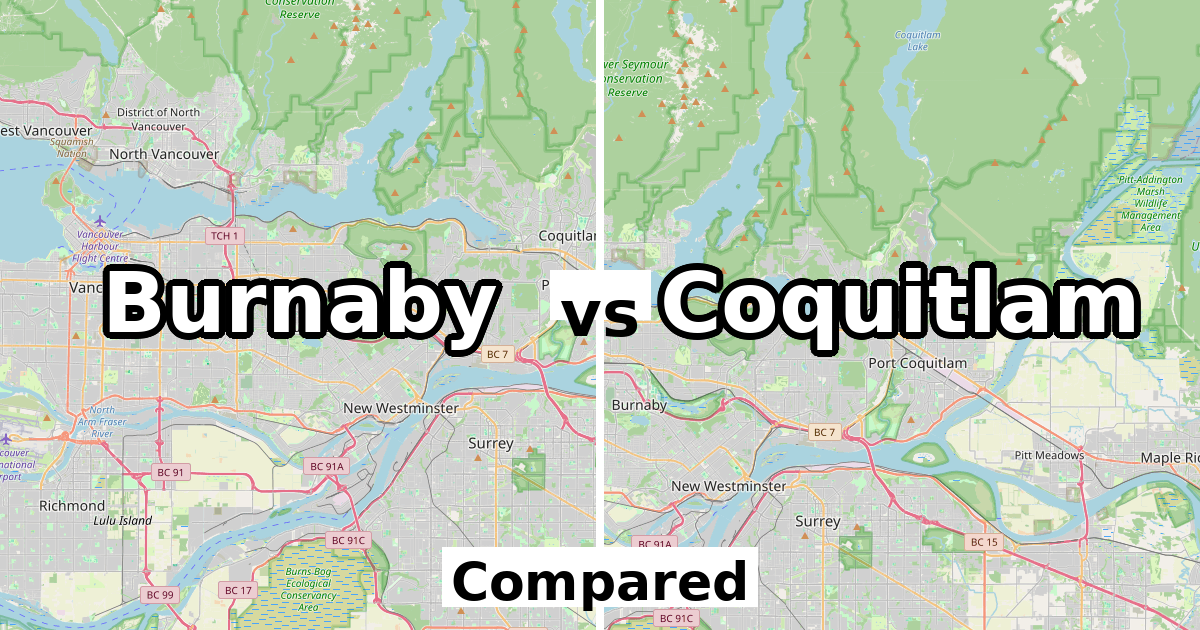
Burnaby and Coquitlam are frequently compared across Metro Vancouver. The numbers put population, growth, income, and age side by side. Here is a clear head-to-head.
Population & growth
Burnaby counted 249,125 residents in 2021, compared with Coquitlam at 148,625. Size, however, is not the same as momentum. Burnaby's population rose 7% from 2016 to 2021, while Coquitlam grew 6.7% over the same period.
In short: Burnaby leads on municipal population; Burnaby grew faster during the last census cycle.
Income
Median after-tax household income tells another part of the story. Coquitlam households sat at $82,000 (median after tax), versus $73,500 in Burnaby. That gap matters for cost-of-living and labour-market conversations across the two cities.
Age profile
Average age was 42 years in Burnaby and 41.4 in Coquitlam. Coquitlam's younger profile contrasts with Burnaby in this census snapshot.
Quick comparison table
- Population (2021): Burnaby 249,125 · Coquitlam 148,625
- Growth 2016–2021: Burnaby 7% · Coquitlam 6.7%
- Median HH income (after tax): Burnaby $73,500 · Coquitlam $82,000
- Average age: Burnaby 42 · Coquitlam 41.4
Burnaby leads on population; Burnaby grew faster over 2016–2021; Coquitlam posts higher median after-tax household income, with Coquitlam slightly younger on average age.
Explore the full datasets
Dig into every section (households, labour, languages, dwellings) on the location profiles, or build your own side-by-side:
- Burnaby demographic profile
- Coquitlam demographic profile
- Location Comparison tool — select Census subdivision, then Burnaby and Coquitlam
Burnaby vs Coquitlam — Key Metrics
Source: Statistics Canada, 2021 Census of Population
Data source → Census methodology & attribution
Back to All Insights