
Who owns, who rents, and where shelter takes 30% of income
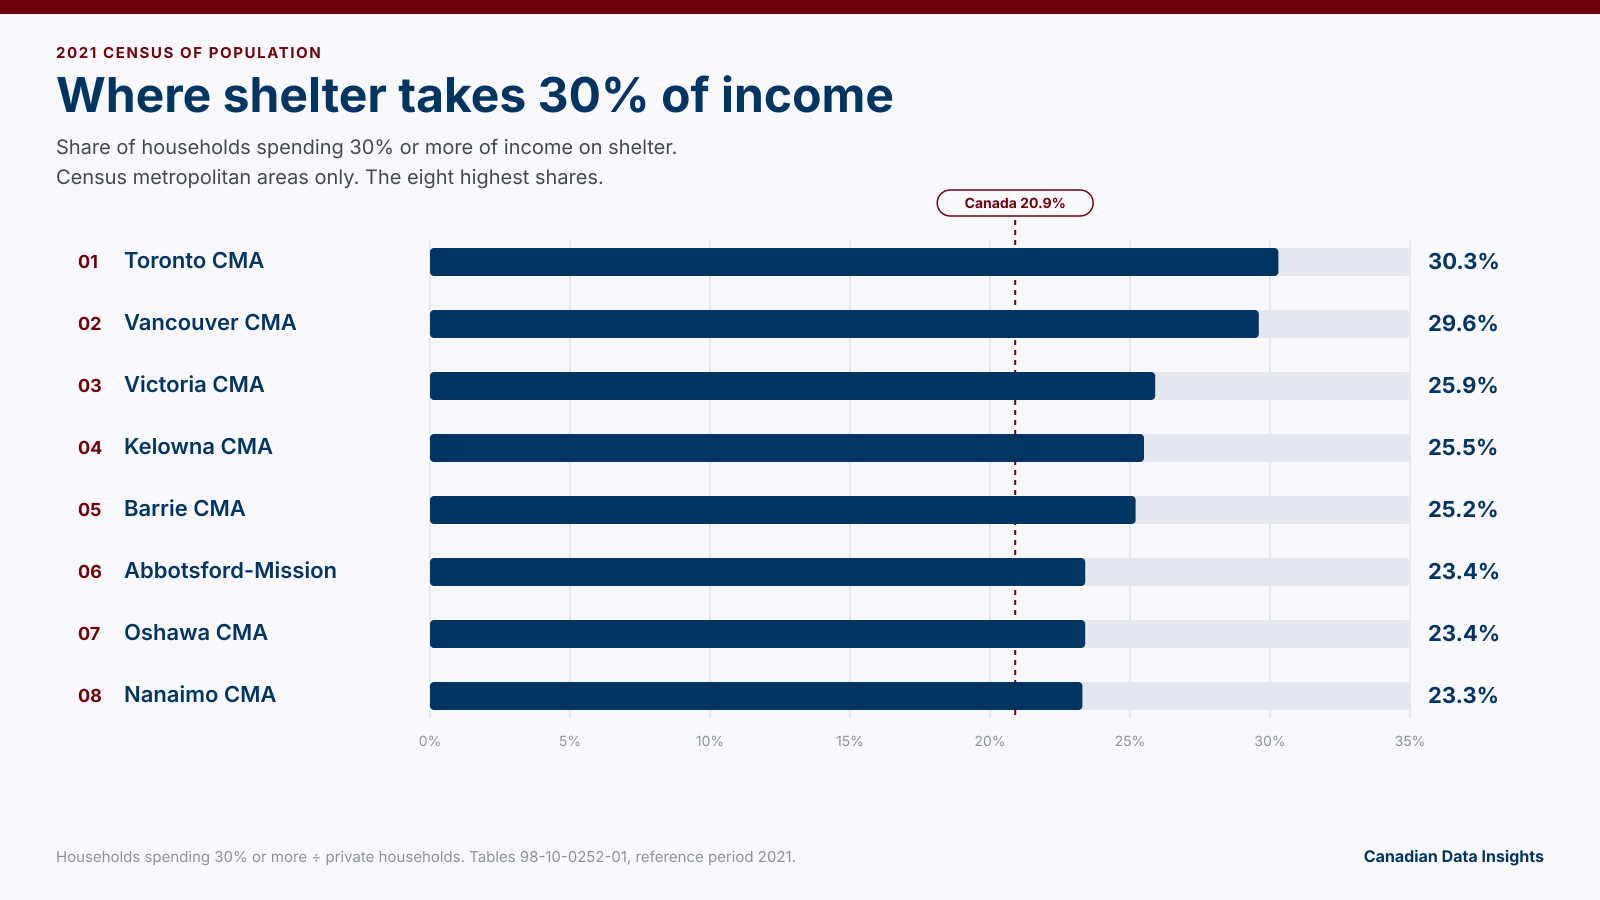
In the 2021 Census, 66.5% of Canada’s private households owned their home, and 20.9% spent 30% or more of income on shelter. Toronto (CMA) had the highest shelter burden of 41 census metropolitan areas, at 30.3%. Montréal (CMA) had the lowest owner share, at 54.4%.
In the 2021 Census, 66.5% of Canada’s private households owned their home: 9,807,720 of 14,744,570. Renters were 33.5% (4,936,850). Across those households, 20.9% spent 30% or more of income on shelter (3,074,715). The median monthly shelter cost was $1,160. Owners’ median was $1,240. Renters’ median was $1,070.
Among owner households, 14.8% spent 30% or more of income on shelter (1,450,000 of 9,807,720). Among renter households, the share was 32.9% (1,624,715 of 4,936,850). Both shares are the published count divided by the published household total for that group, rounded to one decimal the same way the location pages do.
The extract behind this page has 166 geographies: Canada, 13 provinces and territories, 41 census metropolitan areas, and 111 census agglomerations. Tenure and the 30% count are from Statistics Canada table 98-10-0252-01. Median shelter cost is from table 98-10-0253-01. The reference period is 2021. The figures were copied from those tables on November 1, 2026.
Census counts are randomly rounded, so owner plus renter can differ slightly from the household total. In Toronto (CMA), Ont., owner households (1,471,805) plus renter households (789,420) equal 2,261,225, while the published household total is 2,261,220. This page does not fill that gap, and it does not adjust the shares.
The number belongs to the published geography
A census metropolitan area is wider than the city it is named for. The housing block on the Toronto page is Toronto (CMA), Ont. That block is the census metropolitan area. Mississauga, Brampton, Vaughan, Markham, and Oakville have no housing block, because table 98-10-0252-01 does not publish those municipalities on their own.
The same rule applies elsewhere. Surrey, Burnaby, Richmond, and Coquitlam do not show Vancouver (CMA), B.C. Laval and Longueuil do not show Montréal (CMA), Que. Niagara Falls does not show St. Catharines - Niagara (CMA), Ont. Where a link below names a CMA or a CA, the housing anchor on that page is that published area.
Two pages can show one area. Abbotsford - Mission (CMA), B.C. is the housing block on both the Abbotsford page and the Mission page. Kitchener - Cambridge - Waterloo (CMA), Ont. is the housing block on the Kitchener, Cambridge, and Waterloo pages. Each of those pages is showing the census metropolitan area, not the municipality alone.
Where 30% of income goes to shelter
Ranked among the 41 census metropolitan areas, Toronto (CMA), Ont. is first. 30.3% of its households spent 30% or more of income on shelter (685,435 of 2,261,220). Its median shelter cost was $1,700. Owners in that CMA: 25.1% (369,525 of 1,471,805). Renters: 40.0% (315,910 of 789,420). Owner households were 65.1% of CMA households.
Ontario sits below that CMA on both measures. The province’s 30% share was 24.1% (1,312,095 of 5,440,255), and its median shelter cost was $1,370. Owner households were 68.3% (3,718,255 of 5,440,255). Those figures are the province. Toronto (CMA) is one geography inside it.
Shares in the tables are one decimal. Where two areas round to the same tenth, the one with the larger unrounded share is listed first. Abbotsford - Mission (15,595 of 66,510) is just ahead of Oshawa (34,865 of 148,770). Calgary (126,110 of 562,780) is just ahead of Edmonton (122,005 of 545,595).
| Rank | Census metropolitan area | Spending 30% or more | Households | Share | Median shelter |
|---|---|---|---|---|---|
| 1 | Toronto (CMA), Ont. | 685,435 | 2,261,220 | 30.3% | $1,700 |
| 2 | Vancouver (CMA), B.C. | 307,440 | 1,037,535 | 29.6% | $1,550 |
| 3 | Victoria (CMA), B.C. | 45,115 | 173,890 | 25.9% | $1,370 |
| 4 | Kelowna (CMA), B.C. | 22,345 | 87,615 | 25.5% | $1,410 |
| 5 | Barrie (CMA), Ont. | 19,735 | 78,300 | 25.2% | $1,640 |
| 6 | Abbotsford - Mission (CMA), B.C. | 15,595 | 66,510 | 23.4% | $1,370 |
| 7 | Oshawa (CMA), Ont. | 34,865 | 148,770 | 23.4% | $1,620 |
| 8 | Nanaimo (CMA), B.C. | 11,415 | 48,910 | 23.3% | $1,210 |
| 9 | Hamilton (CMA), Ont. | 70,360 | 306,815 | 22.9% | $1,350 |
| 10 | Kingston (CMA), Ont. | 16,485 | 73,165 | 22.5% | $1,270 |
| 11 | Calgary (CMA), Alta. | 126,110 | 562,780 | 22.4% | $1,550 |
| 12 | Edmonton (CMA), Alta. | 122,005 | 545,595 | 22.4% | $1,470 |
Toronto (CMA) is also first among all 166 geographies in the extract, not only among census metropolitan areas. The next two are census agglomerations, not CMAs. Orillia (CA), Ont. is third, at 26.6% (3,835 of 14,425). Collingwood (CA), Ont. is fourth, at 26.5% (2,960 of 11,170). Both are above Victoria (CMA), B.C.
At the other end of the 41 census metropolitan areas, Saguenay (CMA), Que. is last, at 11.7% (8,770 of 74,645). Trois-Rivières (CMA), Que. is next, at 12.4% (9,470 of 76,260), then Drummondville (CMA), Que. at 13.0% (5,925 of 45,420). Québec (CMA), Que. and Saint John (CMA), N.B. both round to 14.3%. Québec’s unrounded share is higher: 55,215 of 386,475, against 7,955 of 55,820 in Saint John.
Who owns
Montréal (CMA), Que. has the lowest owner share of the 41 census metropolitan areas, 54.4% (997,205 of 1,834,620). Renters in that CMA are 837,420, which is 45.6% of CMA households. The 30% share is 19.5% (357,915). The median shelter cost is $1,010. The owner median is $1,310. The renter median is $880. Owners spending 30% or more: 12.7% (126,355 of 997,205). Renters spending 30% or more: 27.7% (231,555 of 837,420).
The lowest owner share among the 111 census agglomerations is lower still. Saint-Hyacinthe (CA), Que. is at 49.6% (13,820 of 27,855), below every census metropolitan area. That page shows the census agglomeration. Nunavut, in the province and territory table below, is lower than Saint-Hyacinthe.
| Rank | Census metropolitan area | Owner households | Households | Owner share |
|---|---|---|---|---|
| 41 | Montréal (CMA), Que. | 997,205 | 1,834,620 | 54.4% |
| 40 | Sherbrooke (CMA), Que. | 57,150 | 104,430 | 54.7% |
| 39 | Trois-Rivières (CMA), Que. | 43,590 | 76,260 | 57.2% |
| 38 | Québec (CMA), Que. | 225,055 | 386,475 | 58.2% |
| 37 | Drummondville (CMA), Que. | 26,570 | 45,420 | 58.5% |
| 36 | Halifax (CMA), N.S. | 117,045 | 199,765 | 58.6% |
| 35 | Victoria (CMA), B.C. | 107,365 | 173,890 | 61.7% |
| 34 | Vancouver (CMA), B.C. | 644,275 | 1,037,535 | 62.1% |
Rank 41 is the lowest owner share. Rank 1, below, is the highest. Five of the eight lowest are in Quebec. Oshawa (CMA), Ont. leads the 41, at 74.9% (111,430 of 148,770).
| Rank | Census metropolitan area | Owner households | Households | Owner share |
|---|---|---|---|---|
| 1 | Oshawa (CMA), Ont. | 111,430 | 148,770 | 74.9% |
| 2 | Chilliwack (CMA), B.C. | 30,200 | 40,865 | 73.9% |
| 3 | Barrie (CMA), Ont. | 57,410 | 78,300 | 73.3% |
| 4 | Windsor (CMA), Ont. | 119,125 | 164,730 | 72.3% |
| 5 | Kamloops (CMA), B.C. | 32,380 | 45,110 | 71.8% |
| 6 | Brantford (CMA), Ont. | 39,615 | 55,515 | 71.4% |
| 7 | St. Catharines - Niagara (CMA), Ont. | 127,280 | 178,440 | 71.3% |
| 8 | Calgary (CMA), Alta. | 396,760 | 562,780 | 70.5% |
Median shelter cost
The median is a different ranking from tenure and from the 30% share. Vancouver (CMA), B.C. and Calgary (CMA), Alta. both have a median monthly shelter cost of $1,550. Vancouver’s owner share is 62.1% (644,275 of 1,037,535) and its 30% share is 29.6% (307,440 of 1,037,535). Calgary’s owner share is 70.5% (396,760 of 562,780) and its 30% share is 22.4% (126,110 of 562,780). Vancouver owners spending 30% or more: 24.3% (156,800 of 644,275). Vancouver renters: 38.3% (150,640 of 393,260). Calgary owners: 17.5% (69,415 of 396,760). Calgary renters: 34.1% (56,695 of 166,020).
When two medians are equal, they share a rank. The area with more households is listed first. That order is not a difference in the median.
| Rank | Census metropolitan area | Median shelter | Owner share | Spending 30% or more |
|---|---|---|---|---|
| 1 | Toronto (CMA), Ont. | $1,700 | 65.1% | 30.3% |
| 2 | Barrie (CMA), Ont. | $1,640 | 73.3% | 25.2% |
| 3 | Oshawa (CMA), Ont. | $1,620 | 74.9% | 23.4% |
| 4 | Vancouver (CMA), B.C. | $1,550 | 62.1% | 29.6% |
| 4 | Calgary (CMA), Alta. | $1,550 | 70.5% | 22.4% |
| 6 | Guelph (CMA), Ont. | $1,480 | 68.7% | 22.0% |
| 7 | Edmonton (CMA), Alta. | $1,470 | 68.8% | 22.4% |
| 8 | Kitchener - Cambridge - Waterloo (CMA), Ont. | $1,410 | 64.6% | 21.9% |
| 8 | Kelowna (CMA), B.C. | $1,410 | 69.8% | 25.5% |
The lowest medians among the 41 are in Quebec. Trois-Rivières (CMA), Que. is lowest, at $695. Then Drummondville (CMA), Que. at $740, Saguenay (CMA), Que. at $755, and Sherbrooke (CMA), Que. at $780.
Census agglomerations extend past either CMA end. The highest median in the 166 geographies is Wood Buffalo (CA), Alta., at $2,300. Next are Yellowknife (CA), N.W.T. at $2,040, Squamish (CA), B.C. at $2,000, and Okotoks (CA), Alta. at $1,840. All four are above Toronto (CMA). The lowest median in the extract is Thetford Mines (CA), Que., at $584.
Provinces and territories
The same two tables publish Canada and every province and territory. Newfoundland and Labrador has the highest owner share, 75.9% (168,660 of 222,275). Nunavut has the lowest, 19.2% (1,905 of 9,925). Among the ten provinces, Quebec is lowest, at 59.9% (2,227,470 of 3,720,980).
British Columbia has the highest 30% share, 25.4% (506,850 of 1,994,660). Nunavut has the lowest, 5.6% (560 of 9,925). Among the ten provinces, New Brunswick is lowest, at 12.9% (42,920 of 333,295).
Northwest Territories has the highest median, $1,550. That is the same published median as Vancouver (CMA) and Calgary (CMA), for a different geography. Among the ten provinces, Alberta is highest, at $1,430. Nunavut’s median is $705, the lowest of the provinces and territories. Canada and Yukon both round to an owner share of 66.5% (Yukon is 11,000 of 16,530). Manitoba and Prince Edward Island both round to 68.6%. New Brunswick and Newfoundland and Labrador both have a median of $800. Prince Edward Island and Quebec both have a median of $900.
| Geography | Owner households | Households | Owner share | Spending 30% or more | Share | Median shelter |
|---|---|---|---|---|---|---|
| Canada | 9,807,720 | 14,744,570 | 66.5% | 3,074,715 | 20.9% | $1,160 |
| Newfoundland and Labrador | 168,660 | 222,275 | 75.9% | 32,390 | 14.6% | $800 |
| Prince Edward Island | 43,730 | 63,710 | 68.6% | 9,865 | 15.5% | $900 |
| Nova Scotia | 283,280 | 422,200 | 67.1% | 75,475 | 17.9% | $940 |
| New Brunswick | 245,110 | 333,295 | 73.5% | 42,920 | 12.9% | $800 |
| Quebec | 2,227,470 | 3,720,980 | 59.9% | 595,690 | 16.0% | $900 |
| Ontario | 3,718,255 | 5,440,255 | 68.3% | 1,312,095 | 24.1% | $1,370 |
| Manitoba | 338,920 | 494,010 | 68.6% | 85,365 | 17.3% | $1,070 |
| Saskatchewan | 298,500 | 416,045 | 71.7% | 71,445 | 17.2% | $1,060 |
| Alberta | 1,131,995 | 1,595,570 | 70.9% | 337,585 | 21.2% | $1,430 |
| British Columbia | 1,330,795 | 1,994,660 | 66.7% | 506,850 | 25.4% | $1,350 |
| Yukon | 11,000 | 16,530 | 66.5% | 2,665 | 16.1% | $1,300 |
| Northwest Territories | 8,100 | 15,110 | 53.6% | 1,805 | 11.9% | $1,550 |
| Nunavut | 1,905 | 9,925 | 19.2% | 560 | 5.6% | $705 |
Owners with a mortgage, and where to open the table
In Canada, 5,881,675 owner households had a mortgage. Their median shelter cost was $1,840. Owners without a mortgage were 3,926,045, and their median was $584. Those two counts add up to the 9,807,720 owner households. The mortgage split and those medians are from table 98-10-0253-01. The 30% counts are from table 98-10-0252-01.
These 2021 shelter costs are a different statistic from the Consumer Price Index. The September 2026 index is table 18-10-0004-01, on the cost-of-living page and in September 2026 consumer prices. This post does not compare a 2021 median shelter cost with that index.
Open a linked place for the full housing block, including shelter-cost bands. The geography named in the link is the geography on the page.
Sources
Household counts, tenure, and households spending 30% or more of income on shelter are from Statistics Canada table 98-10-0252-01, reference period 2021. Median monthly shelter costs, and the mortgage split, are from table 98-10-0253-01, reference period 2021. Shares on this page are calculated here from those published counts. The extract was taken on November 1, 2026. See how this site handles these tables. Statistics Canada data is used under the Open Government Licence – Canada. Adapted from Statistics Canada, Census of Population, 2021, tables 98-10-0252-01 and 98-10-0253-01. This does not constitute an endorsement by Statistics Canada of this product. This post is by Andrew.
Households spending 30% or more on shelter, census metropolitan areas (percent)
Source: Statistics Canada, 2021 Census of Population
Data source → Census methodology & attribution
Back to All Insights